PoweringSustainableGrowth
“This marks the 20th year of Applied Materials’ impact reporting. It also marks the midpoint toward our bold 2030 sustainability goals, first announced in 2020.”
Message From Our CEO, PDF p. 4
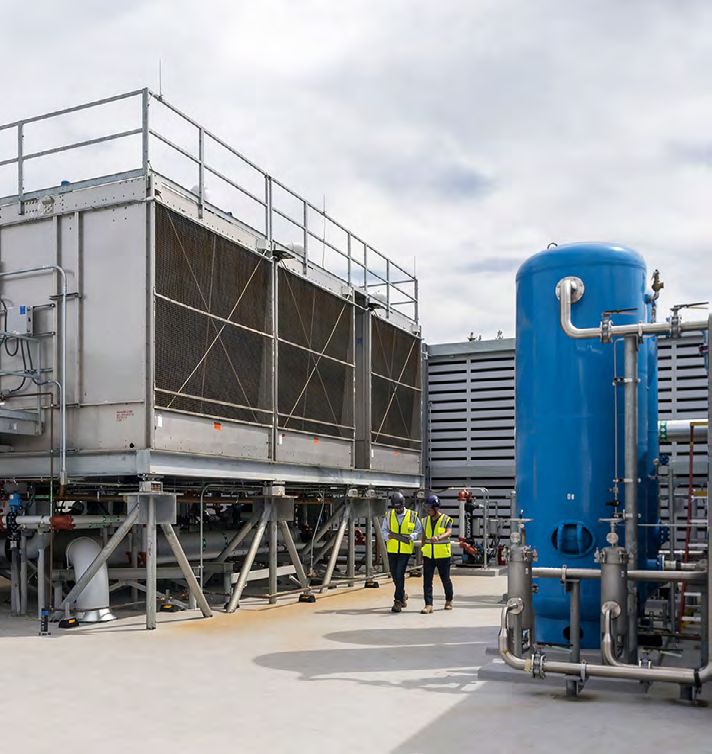
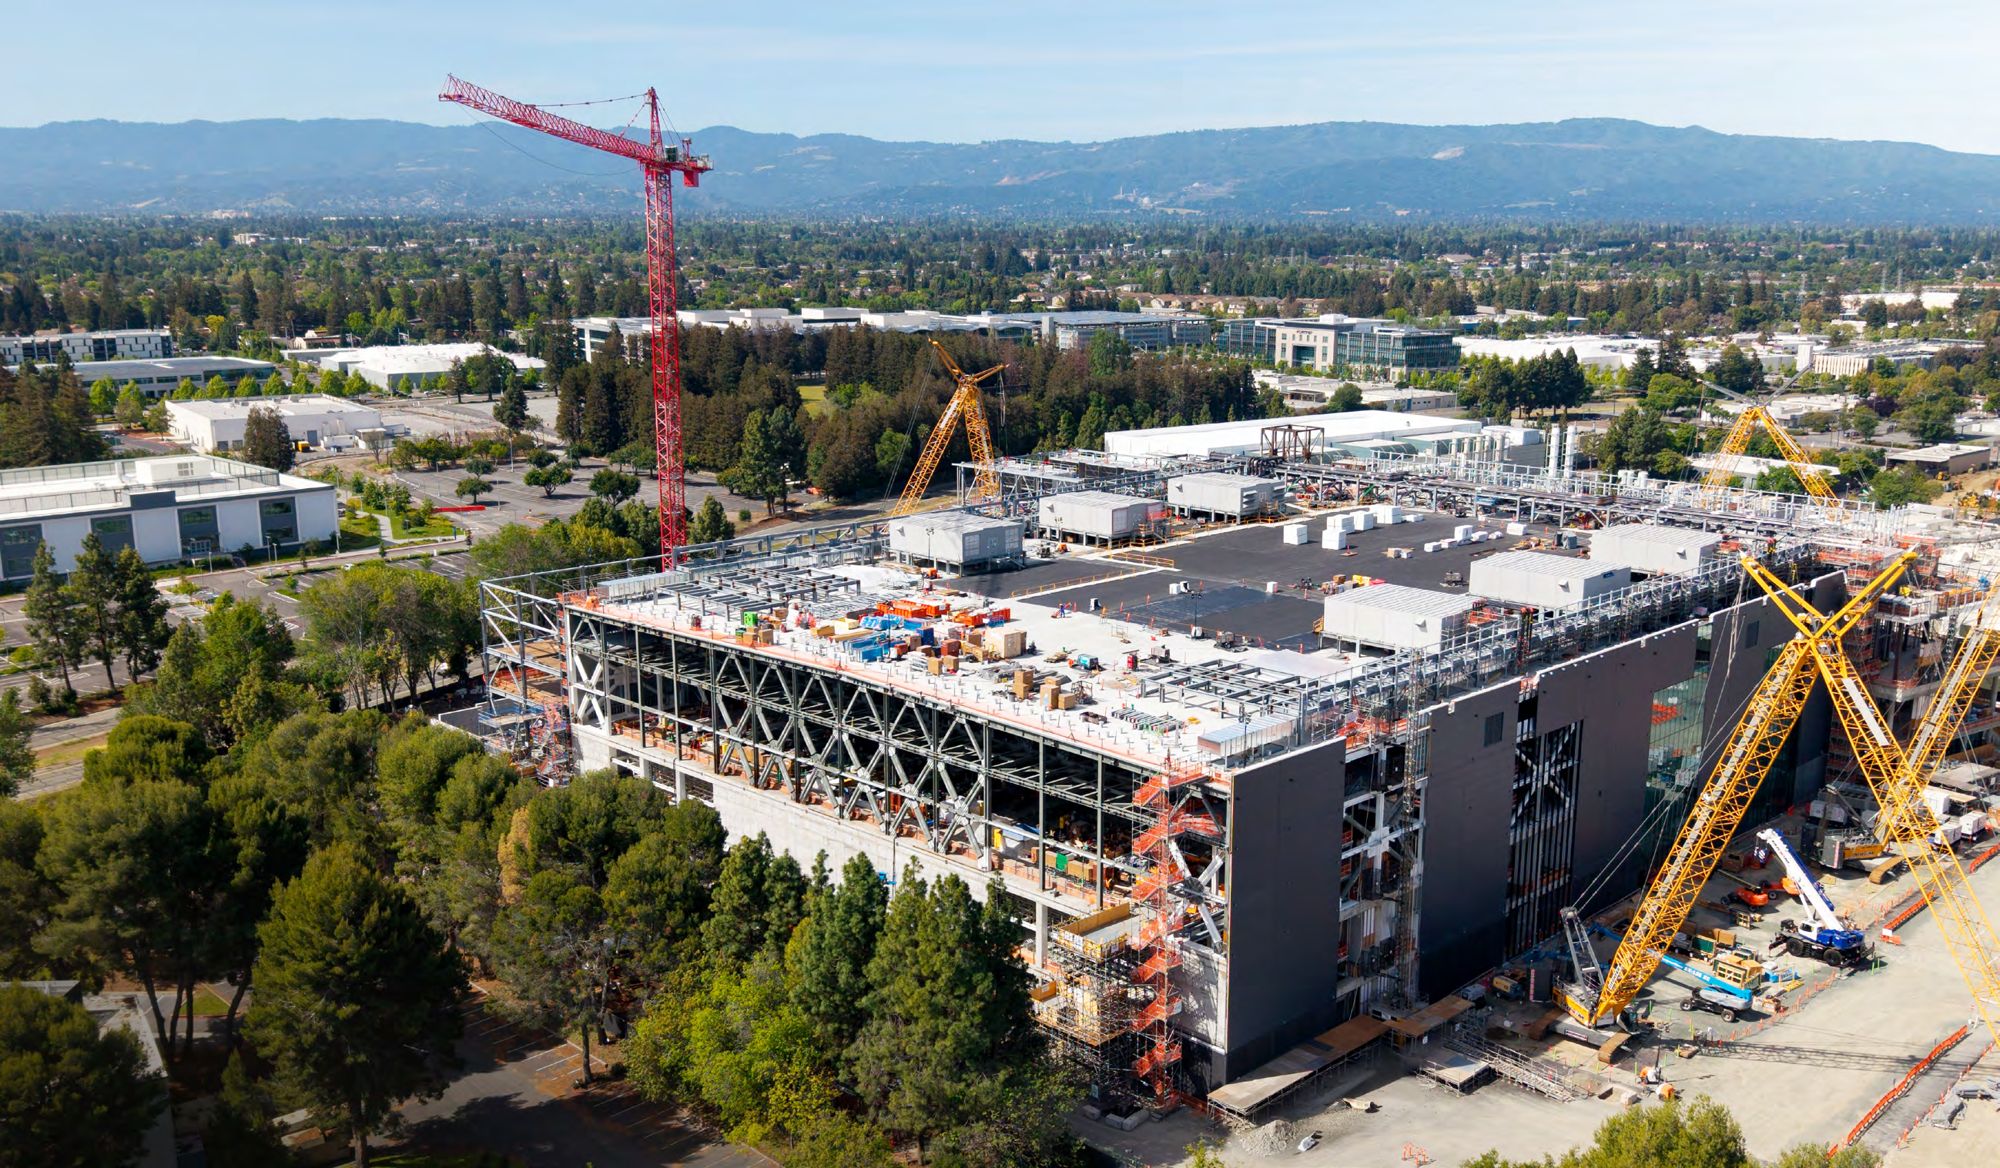
On the cover: the EPIC Center, on track to open in late 2026.
Introduction
2025 Highlights
- >99%of Applied's carbon footprint is Scope 3
- 31%lower product-use emissions intensity vs. FY 2019
- 75%of global electricity matched with renewable sources
- 2.2Mhours of learning and development
- $17.8Minvested in global communities
- 202supplier sites assessed
Advanced Scope 3 decarbonization—which represents more than 99% of our carbon footprint—by reducing product-use emissions intensity 5% year over year and 31% from our fiscal 2019 baseline
Delivered measurable product sustainability gains by improving energy efficiency across semiconductor tools, expanding the ecoUP™ and ECO Services portfolios, and enabling 95% to 99% destruction‑removal efficiency for greenhouse gas (GHG) abatement technologies—directly reducing the carbon intensity of semiconductor chipmaking
Invested in scaling semiconductor equipment manufacturing capacity to support global market growth driven by AI, including developing a new advanced manufacturing facility in Arizona, expanding the joint lab with CEA‑Leti in France and establishing an AI Center of Excellence in India
Expanded Applied’s clean‑energy portfolio by signing our largest virtual power purchase agreement (VPPA) to maintain matching 100% of electricity with renewable sources for our U.S. operations—including the estimated additional power needs of the EPIC Center once operational—while matching 75% of electricity with renewable sources globally through increased on-site solar generation and long-term clean-energy sourcing
Strengthened a skilled, future‑ready global workforce through 2.2 million hours of learning and development, a unified management and leadership curriculum and expansion of emerging talent pathways
Elevated responsible manufacturing performance by advancing rigorous governance, enhancing training and increasing compliance across our operations and supply chain—highlighted by Applied Materials Singapore earning a Platinum rating under the Responsible Business Alliance’s Validated Assessment Program with a perfect 200/200 score
Advanced a stronger, more resilient supply chain by assessing 202 supplier sites, expanding Responsible Business Alliance-aligned training and governance programs, increasing renewable-energy adoption among suppliers and continuing due diligence efforts to protect human rights and support responsible minerals sourcing
Deepened social impact through $17.8 million in investments by Applied Materials and the Applied Materials Foundation in global communities, supporting more than 2,200 nonprofits and strengthening science, technology, engineering and math (STEM) pathways for semiconductor and AI careers
Video
How does Applied Materials lead the way in powering sustainable growth?
Applied Materials on YouTube (opens in a new tab)Placeholder video from Applied Materials’ YouTube channel. Not part of the 2025 Impact Report PDF.
Empowering People
- 2025 Highlights
- Connected Coworkers
- Human Rights
- Community Impact

Our core values are the foundation of our culture. By living them every day, we achieve superior results and create lasting value for our business, our industry and the world.
At Applied, we strive to build genuine connections, welcome diverse perspectives and respect each person’s differences. We are committed to maintaining a safe, inclusive and professional workplace where everyone can grow and perform at their best.
Human rights and workforce management are among our highest-priority material issues. We invest in continuous employee development and growth and in building exceptional managers and leaders who serve as ambassadors of our culture.
Applied unites the brightest minds to solve our customers’ highest-value problems, empowering people to deliver material innovation that has a positive impact on society. Central to our culture is our People Promise: “The work we do together advances the world’s technology.”
Video
Deliver Material Innovation at Applied Materials
Applied Materials on YouTube (opens in a new tab)Placeholder video from Applied Materials’ YouTube channel. Not part of the 2025 Impact Report PDF.
Our people in numbers
Community investments
Applied Materials, Inc. and the Applied Materials Foundation, $ millions
View data table
| Year | Applied ($M) | Foundation ($M) | Total ($M) |
|---|---|---|---|
| FY 2019 | 2.8 | 8 | 10.8 |
| FY 2022 | 2.8 | 8.4 | 11.2 |
| FY 2023 | 3.1 | 8.5 | 11.7 |
| FY 2024 | 4.7 | 9.8 | 14.5 |
| FY 2025 | 4.3 | 13.5 | 17.8 |
Female representation of the global workforce
FY 2025, % of each group
- Total women in workforce20.7%
- Women professionals (business, engineering and sales)28.3%
- Women managers (people managers)18.2%
- Women engineering employees16.4%
- Women executives (vice presidents and directors)14.4%
View data table
| Group | % |
|---|---|
| Total women in workforce | 20.7% |
| Women professionals (business, engineering and sales) | 28.3% |
| Women managers (people managers) | 18.2% |
| Women engineering employees | 16.4% |
| Women executives (vice presidents and directors) | 14.4% |
Workforce and safety
Total workforce and FY 2025 incident rates
total workforce in FY 2025, up from 23,234 in FY 2019
Safety rates from PDF p. 72. FY 2024: TRIR 0.41, LTIR 0.20, DART 0.31.
View data table
| Year | Total workforce |
|---|---|
| FY 2019 | 23,234 |
| FY 2022 | 36,737 |
| FY 2023 | 36,605 |
| FY 2024 | 37,081 |
| FY 2025 | 37,741 |
Environmental Progress
- 2025 Highlights
- Goals and Progress
- Progress on GHG Emissions
- Net Zero 2040 Playbook™
- Product Efficiency
- Supply Chain Emissions
- Circular Economy
- Waste Management
- Water Management
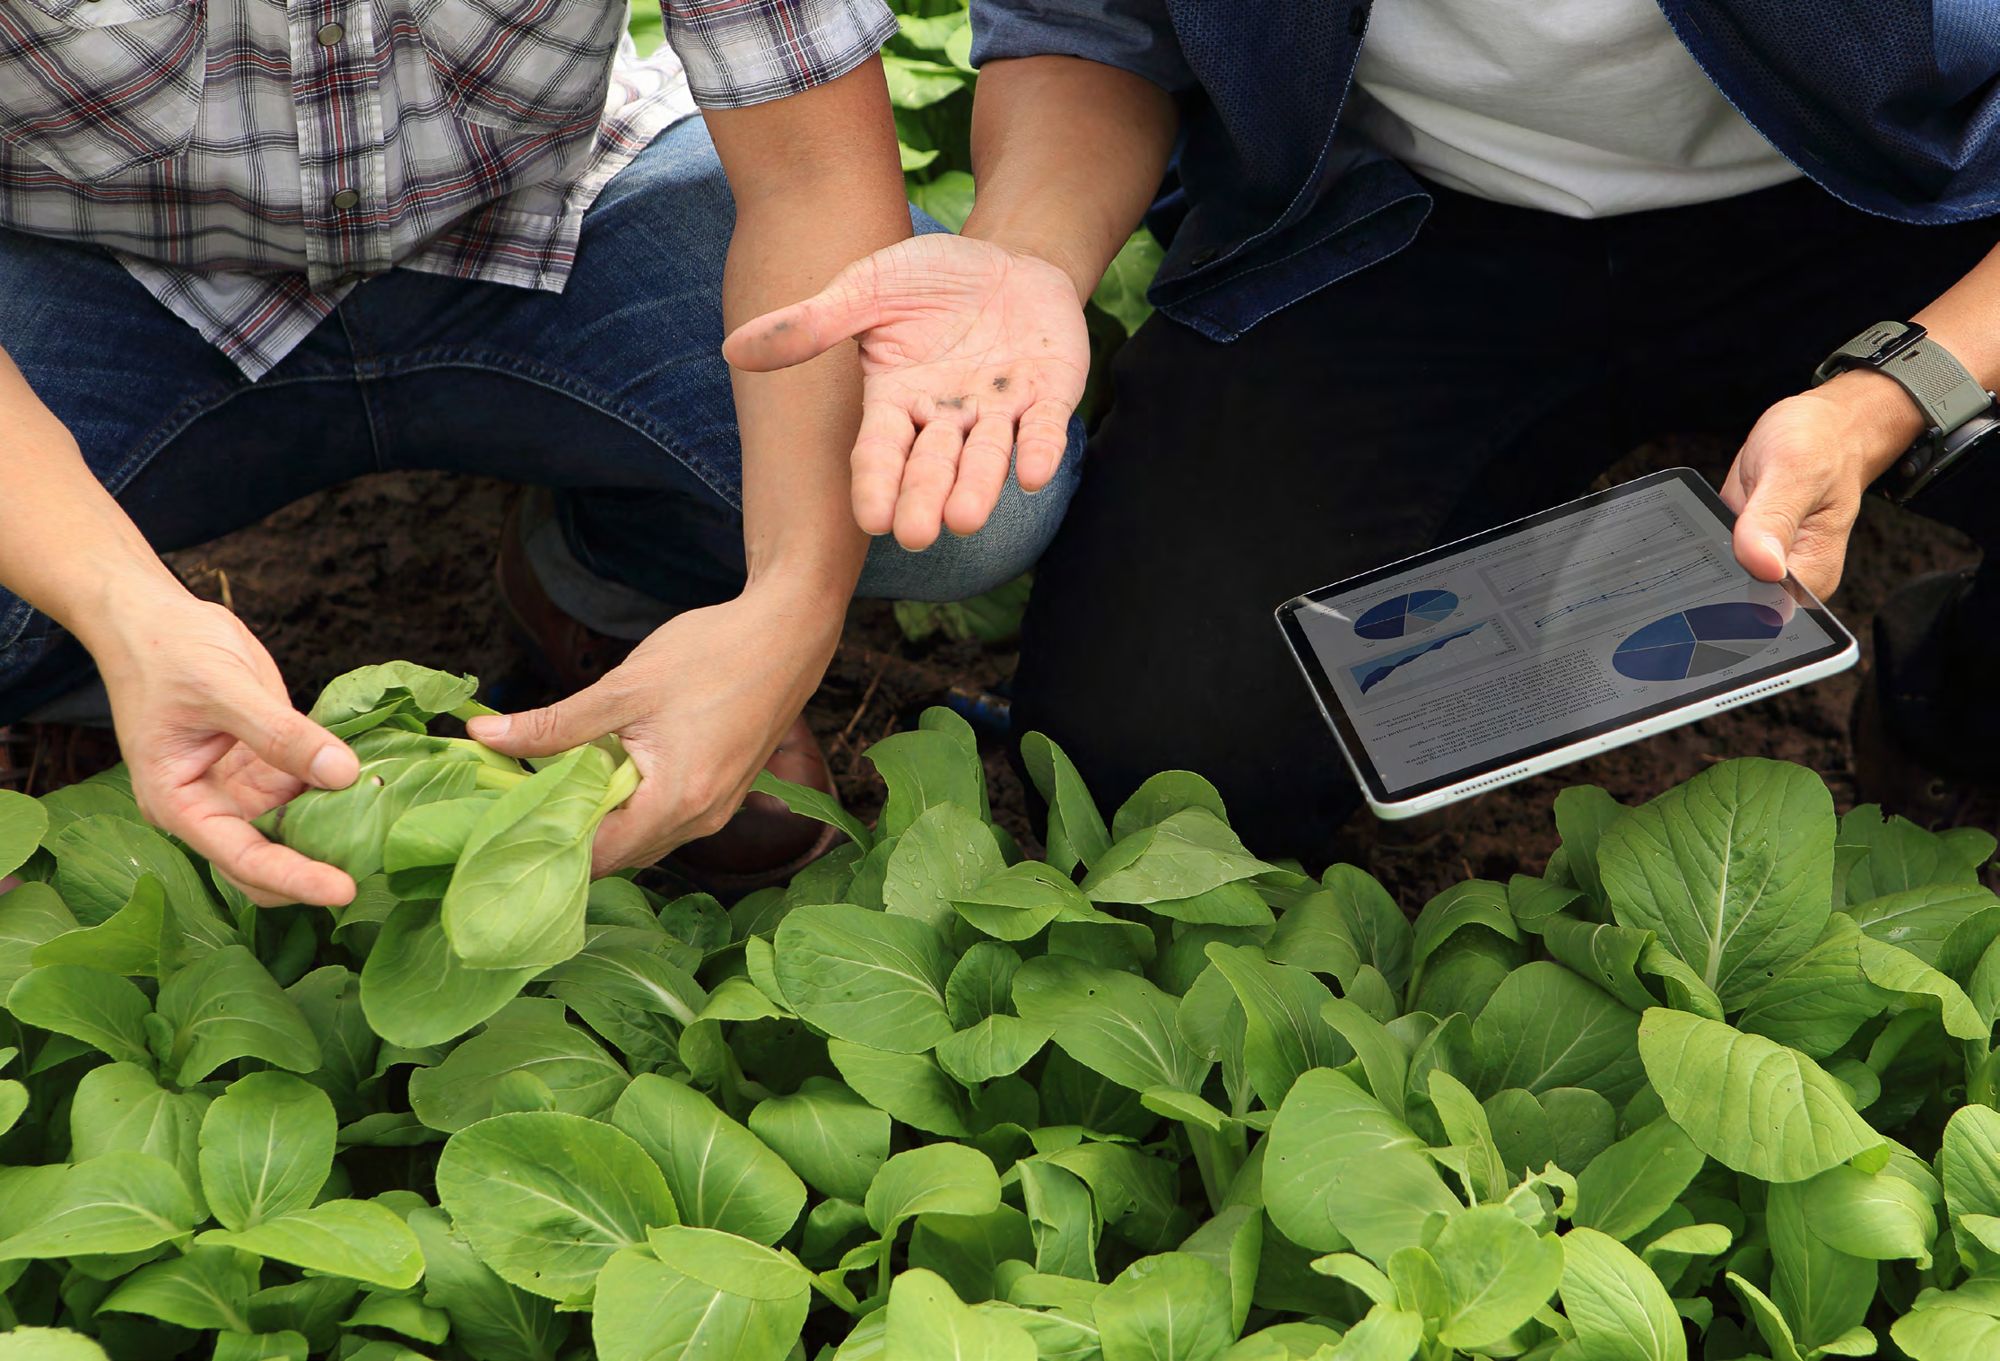
We are accelerating energy-efficient computing and reducing environmental impacts across our value chain—critical steps to enable sustainable AI and safeguard our planet’s future.
Our environmental progress strategy is anchored in the Net Zero 2040 Playbook™, a collaborative roadmap to reduce emissions within our operations and across the semiconductor ecosystem.
In the U.S., we continue to match 100% of electricity with renewable sources and secured our largest virtual power purchase agreement (VPPA). Globally, 75% of our electricity is matched with renewable sources.
We are also making meaningful progress on our Scope 3 science‑based target, reducing product-use emissions intensity 5% year over year and achieving a 31% reduction from our fiscal 2019 baseline.
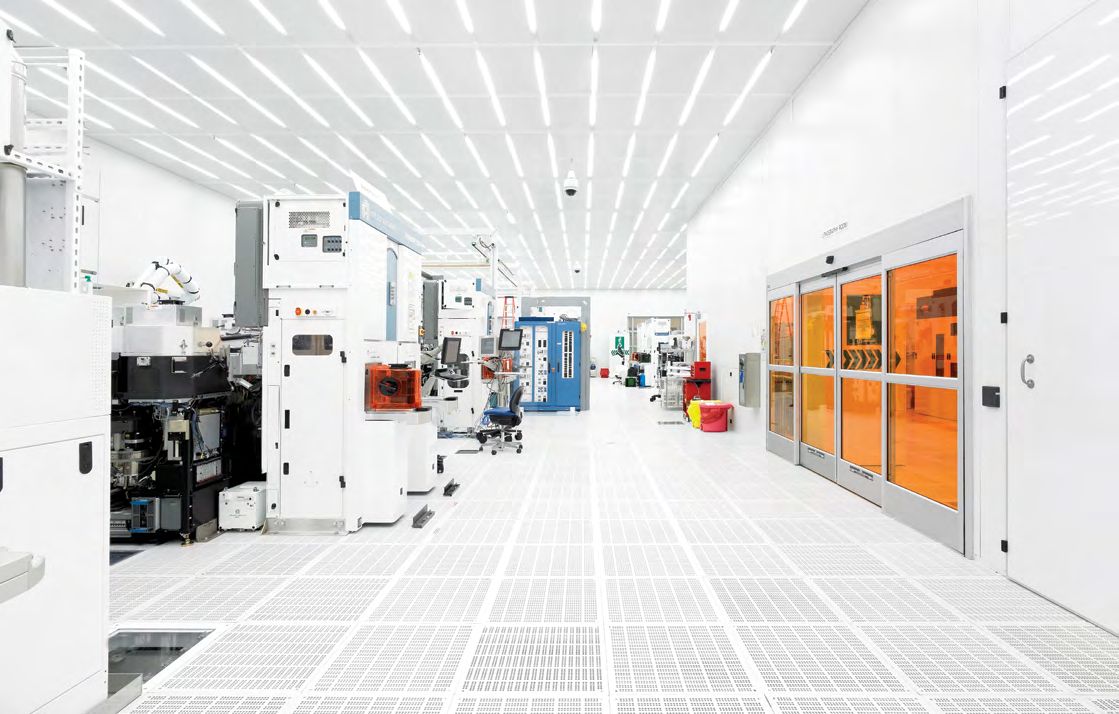
Video
Explain2Me: Semiconductors and Sustainability
Applied Materials on YouTube (opens in a new tab)Placeholder video from Applied Materials’ YouTube channel. Not part of the 2025 Impact Report PDF.
Goals and Progress
Scope 1, 2 and 3 Science-Based Targets
| Goal | Progress* | Status |
|---|---|---|
| 100% of electricity at Applied globally is matched with renewable sources by 2030 from 2019 baseline | 75% of electricity at Applied globally, including 100% in the U.S., was matched with renewable sources | On target |
| 50% absolute reduction in Scope 1 and Scope 2 (market-based) emissions by 2030 from 2019 baseline | Scope 1 and 2 (market-based) emissions are 0.1% above our 2019 baseline levels | In progress |
| 55% intensity-based reduction per million USD of value added of Scope 3 Category 11 emissions by 2030 from 2019 baseline for semiconductor products | 31% intensity-based reduction per million USD of value added of Scope 3 Category 11 emissions from our 2019 baseline | On target |
| Partner with top 80% of direct suppliers by spend on transition to clean energy | 55 of our top-spend supplier sites (25% of spend) reported using at least 80% clean energy | In progress |
3x30 Goals
| Goal | Progress* | Status |
|---|---|---|
| Reduce equivalent energy consumption per wafer pass (in kWh) for semiconductor products by 30% by 2030 from 2019 baseline | 17% average improvement in energy consumption per wafer pass across all semiconductor products from 2019 baseline | On target |
| Reduce the impact from chemical consumption per wafer pass (in metric tons of CO2e) for semiconductor products by 30% by 2030 from 2019 baseline | We have identified a pathway to meet this target. While high-impact chemicals are still needed to meet the industry demands for on-wafer performance improvement, Applied’s engineering teams are successfully bending the curve to improve efficiency faster than these demands increase. | In progress |
| 30% reduction in tool footprint per production unit ratio (sqm/wph) for semiconductor products by 2030 from 2019 baseline | We are on track to meet or exceed this target through a combination of productivity improvements and new product architectures | On target |
*Cumulative through FY 2025 unless otherwise noted. Status as shown in the report.
Progress on GHG emissions
Applied is advancing toward achieving our 2030 emissions goals, validated by the Science Based Targets initiative (SBTi) as aligned with the 1.5°C pathway.
Scope 1 and 2 GHG emissions and intensity by year
MT CO2e (bars) and MT CO2e per $M revenue (line)
View data table
| Year | Scope 1 | Scope 2 (market) | Total | Intensity |
|---|---|---|---|---|
| FY 2019 | 35,225 | 78,677 | 113,902 | 7.8 |
| FY 2022 | 48,633 | 72,933 | 121,566 | 4.7 |
| FY 2023 | 49,053 | 71,469 | 120,522 | 4.5 |
| FY 2024 | 50,775 | 67,681 | 118,456 | 4.4 |
| FY 2025 | 54,264 | 59,721 | 113,985 | 4.0 |
Where Scope 3 emissions come from
FY 2025 total: 20,546,581 MT CO2e
of Scope 3 comes from the use of sold products (Category 11)
- Cat. 11 Use of sold products81.7%
- Cat. 1 Purchased goods and services9.8%
- Cat. 4 Upstream transportation and distribution3.1%
- Cat. 2 Capital goods1.9%
- Cat. 15 Investments1.6%
- All other categories (3, 5, 6, 7, 8, 9, 12, 13)2.0%
Scope 3 represents more than 99% of Applied’s carbon footprint (PDF p. 5).
View data table
| Category | MT CO2e | Share |
|---|---|---|
| Cat. 11 Use of sold products | 16,790,766 | 81.7% |
| Cat. 1 Purchased goods and services | 2,004,627 | 9.8% |
| Cat. 4 Upstream transportation and distribution | 630,549 | 3.1% |
| Cat. 2 Capital goods | 380,741 | 1.9% |
| Cat. 15 Investments | 337,922 | 1.6% |
| All other categories (3, 5, 6, 7, 8, 9, 12, 13) | 401,976 | 2.0% |
Electricity matched with renewable sources
% of electricity, global and U.S.
- FY 201939%51%
- FY 202269%100%
- FY 202370%100%
- FY 202473%100%
- FY 202575%100%
View data table
| Year | Global | U.S. |
|---|---|---|
| FY 2019 | 39% | 51% |
| FY 2022 | 69% | 100% |
| FY 2023 | 70% | 100% |
| FY 2024 | 73% | 100% |
| FY 2025 | 75% | 100% |
Water withdrawal intensity
Thousand m3 per $M revenue
in FY 2025, down from 0.14 in FY 2019
Total water withdrawal was 2,612 thousand m3 in FY 2025.
View data table
| Year | Withdrawal (thousand m3) | Intensity per $M revenue |
|---|---|---|
| FY 2019 | 2,016 | 0.14 |
| FY 2022 | 2,359 | 0.09 |
| FY 2023 | 2,388 | 0.09 |
| FY 2024 | 2,510 | 0.09 |
| FY 2025 | 2,612 | 0.09 |